
★ Moneyball Original · Opinion
Three defeats in a row: is Enzo Maresca still the right man for Manchester City?
By Moneyball Editorial · published · updated
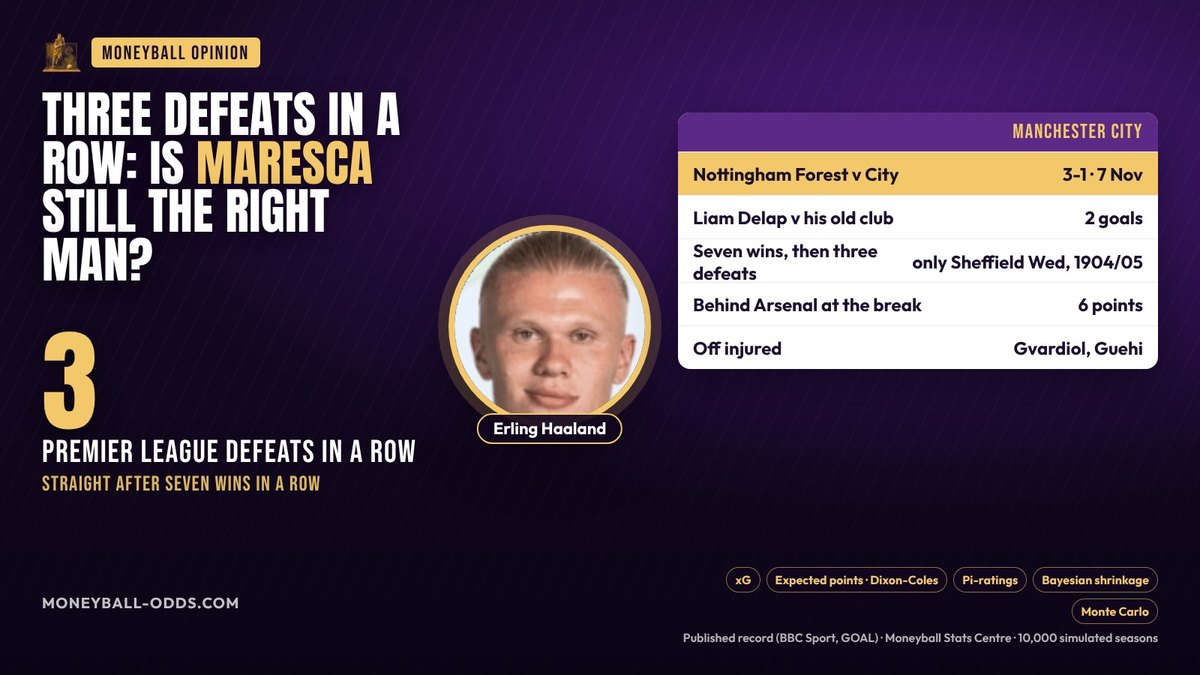
Seven Premier League wins in a row, then three defeats in a row. The last of them came on Saturday at the City Ground: Nottingham Forest 3-1 Manchester City. Jair Cunha scored after six minutes when Josko Gvardiol lost the ball, and Liam Delap scored twice against the club that sold him. Only one side in English top-flight history had won its first seven and then lost the next three: Sheffield Wednesday, in 1904/05. Manchester City go into the international break 6 points behind Arsenal, with Gvardiol and Marc Guehi both forced off injured.
In the BBC studio Danny Murphy called City's display poor in its mentality and even a little arrogant, and Steve Stone said the back four is not cohesive, with full-backs so wide that one quick pass goes straight through. Those are opinions. Here are the numbers, read with twelve Moneyball methods, to answer the only question that matters at a club like City: is Enzo Maresca still the right man?
The run, match by match
| Date | Match | Score | xG (City – opponent) | Result | Chance of that defeat |
|---|---|---|---|---|---|
| 24 October 2026 | at Aston Villa | 1-2 | 1.79 – 0.66 | L | 25% |
| 31 October 2026 | v Brighton & Hove Albion | 0-1 | 2.06 – 0.97 | L | 26% |
| 7 November 2026 | at Nottingham Forest | 1-3 | 1.56 – 1.06 | L | 37% |
The last column is how often a team of City's strength loses each of those matches, from the two clubs' shrunk strengths through the Dixon-Coles matrix. Multiplied together, 3 defeats in a row was a 2.5% event: about one run in 40. Unlikely runs do happen to good teams; the question is whether the chances say it was bad luck or a different team.
Bad luck or a different team? The chances before and during the run
| Per match | Before the run | The last 3 |
|---|---|---|
| xG for | 2.04 | 1.80 |
| xG against | 1.17 | 0.90 |
| xG margin | +0.87 | +0.91 |
The chances have not collapsed: City's xG margin in the run is +0.91 a match against +0.87 before it. The results have turned faster than the football.
The table, four ways
| Measure | Manchester City | Rank of 20 |
|---|---|---|
| League position (points) | 21 pts from 10 | 3rd |
| Expected points (from xG) | 19.1 from 10 | 2nd |
| Pi-rating (goal margin vs average) | +0.11 | 3rd |
| Strength after shrinkage (xG margin per match) | +0.49 | 1st |
| Projected final points | 69 | 2nd |
On expected points City would have 19.1 against the 21 they have: points and chances agree. Their xG margin, +0.88 a match, is 1st in the league once shrinkage has taken the noise out of a short season; their Pi-rating, built from results alone, is 3rd.
Without the ball: Stone's back four
City allow 1.09 xG a match, 3rd of 20. They make 13.2 tackles (17th) and 6.5 interceptions (20th) a match. Their Pressure Index is 72.9, 1st: they still press as hard as anyone, which leaves the space behind exposed when the first line is beaten. They have conceded 13 from 10.9 xG against (−2.1 kept out): the goalkeeping has not been bailing them out.
Gvardiol and Guehi going off injured at the City Ground matters more than one bad afternoon. Murphy's advice was to keep the same back four for a while; with two centre-backs hurt, Maresca may not be able to.
With the ball
City create 1.97 xG a match (1st), with 65.5% of the ball (1st) and 3.4 big chances a match (1st). They have scored 21 from 19.7 xG (+1.3): the goals match the chances.
Erling Haaland: 14 goals from 9.63 xG in 1160 minutes this season, every competition, a rating of 7.43. The striker is not the problem.
The players
City's best-rated players this season (270 minutes or more, every competition). Each name opens his Stats Centre page.
| Player | Minutes | Rating | Goals | Assists | xG |
|---|---|---|---|---|---|
| Erling Haaland | 1160 | 7.43 | 14 | 0 | 9.63 |
| Elliot Anderson | 1079 | 7.36 | 1 | 2 | 1.02 |
| Rayan Cherki | 854 | 7.29 | 6 | 2 | 3.43 |
| Phil Foden | 593 | 7.22 | 4 | 3 | 3.50 |
| Jérémy Doku | 468 | 7.17 | 1 | 1 | 1.44 |
| Enzo Fernández | 960 | 7.15 | 2 | 2 | 2.10 |
| Antoine Semenyo | 705 | 7.00 | 2 | 3 | 1.00 |
| Iliman Ndiaye | 925 | 6.96 | 0 | 5 | 2.27 |
10,000 seasons: what the run costs
| In 10,000 simulated seasons | Manchester City |
|---|---|
| Win the Premier League | 20% |
| Finish in the top four | 87% |
| Most likely finishing place | 2nd |
| Typical final points (median) | 69 |
Arsenal win it in 61% of the same 10,000 seasons.
| # | Club | Pts | xPts | Pts − xPts | Pi | Projected |
|---|---|---|---|---|---|---|
| 1 | Arsenal | 27 | 19.3 | +7.7 | +0.20 | 74 |
| 2 | Brighton & Hove Albion | 22 | 17.0 | +5.0 | +0.25 | 66 |
| 3 | Manchester City | 21 | 19.1 | +1.9 | +0.11 | 69 |
| 4 | Liverpool | 18 | 15.8 | +2.2 | +0.08 | 60 |
| 5 | Chelsea | 16 | 13.2 | +2.8 | +0.04 | 54 |
| 6 | Everton | 16 | 12.8 | +3.2 | +0.04 | 52 |
So, is Maresca still the right man?
- The run. 3 defeats in a row was roughly a one-in-40 event for a side this strong.
- The process. An xG margin of +0.88 a match, 1st in the league.
- The defence. xG against 1.17 a match before the run, 0.90 during it.
The Moneyball view
Yes. The football that won seven in a row is still in the numbers; three results have not undone it. Clubs sack managers on runs of results; the numbers judge them on the chances their teams make and allow, because those predict what comes next far better than three scores do. Fix the back four, with Gvardiol and Guehi fit or without them, and the run is far more likely to be remembered as an autumn wobble than as the end of an era. City win the title in 20% of our 10,000 seasons and most often finish 2nd. This column updates itself after every round.
- Expected goals (xG): the quality of every chance, so a team is judged on what it created and allowed, not only on what went in.
- Expected points: each match's xG run through a Dixon-Coles score matrix (the Poisson model with the low-score correction the Match Board uses) to give the points a performance usually earns.
- Pi-ratings: a rating for every club at home and away, moved after each result by how far the goal margin beat or missed what the ratings expected.
- Bayesian shrinkage: a club's xG margin is pulled toward the league average as if it had 8 average matches more, so a hot month is not mistaken for a new level.
- Projection: the shrunk strength played out against an average opponent for every match left, added to the points already won.
- Monte Carlo season simulation: the rest of the league played 10,000 times, every match drawn from the Dixon-Coles matrix at each club's shrunk strength, for the chance of every finishing place.
- Finishing regression: goals scored against the xG behind them. A big gap rarely lasts a season.
- Goalkeeping regression: goals conceded against the xG faced, the other end of the same test.
- Home and away split: points per match on each side of the fixture list.
- League ranks on Sportmonks' team figures: possession, passing, pressure, chances, duels.
- Player ratings per 90, from the same Sportmonks data that runs Moneyball Scout.
- Run probability: the chance of each defeat from the two clubs' strengths, multiplied, to tell a rare run from a worse team.
Analysis by Moneyball Editorial. The score of Nottingham Forest v Manchester City, its scorers, the seven-wins-then-three-defeats record, the six-point gap at the break and the injuries are the published record (BBC Sport, GOAL); the views of Danny Murphy and Steve Stone were given to BBC Sport and BBC Radio 5 Live. Every other figure is read from the Moneyball Stats Centre (Sportmonks data) and updates itself with the data.
Manchester City in the Stats Centre The Premier League table
Questions
- What was the score in Nottingham Forest v Manchester City?
- Nottingham Forest 3-1 Manchester City on 7 November 2026 at the City Ground. Jair Cunha scored in the sixth minute and Liam Delap scored twice against his former club.
- How many games in a row have Manchester City lost?
- Three Premier League matches in a row, straight after seven wins in a row. Only Sheffield Wednesday in 1904/05 had won their first seven and then lost the next three in the top flight.
- Will Manchester City sack Enzo Maresca?
- Nothing has been announced. On Moneyball's numbers City are 3rd on 21 points, 1st on the strength their chances show, and win the title in 20% of 10,000 simulated seasons.
- How far are Manchester City behind Arsenal?
- 6 points going into the November international break.
- Where do the numbers come from?
- Sportmonks match, team and player data, read by the Moneyball engine and the Stats Centre, refreshed with every update of the site.