
★ Moneyball Original · Opinion
Xabi Alonso's weakness, exposed? What the numbers really say about his Chelsea
By Moneyball Editorial · published · updated
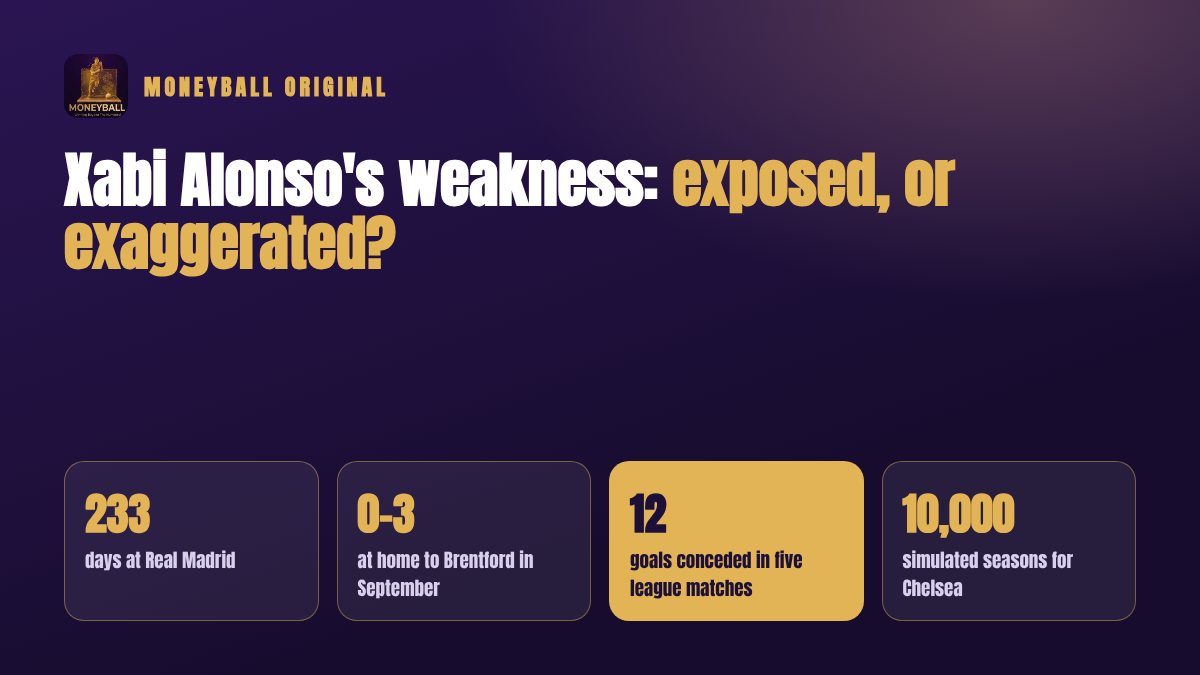
Xabi Alonso came to Chelsea with a reputation made at Bayer Leverkusen and bruised at Real Madrid, where he lasted 233 days before being dismissed in January. By September the questions had followed him to London. A 3-0 home defeat to Brentford made it three league matches without a win and, by Sky Sports' count, 12 goals conceded in five.
"His weakness has been exposed" is now a headline in several languages. A headline is not a measurement. If there is a weakness, it will show in what a team does week after week: in the chances it allows, in where it ranks against the rest of the league, and in whether the points match the football. That is where this column looks.
Moneyball reads a coach the way it reads a player: by what his team does on the pitch, measured the same way for every club. Twelve methods, the Stats Centre for the club and for its players, and 10,000 simulated seasons. Each idea is explained in plain words as it comes up, so you do not need to know what xG means before you start.
1. The table, read four ways
| Measure | Chelsea | Rank of 20 |
|---|---|---|
| League position (points) | 16 pts from 10 | 5th |
| Expected points (from xG) | 13.2 from 10 | 12th |
| Pi-rating (goal margin vs average) | +0.04 | 7th |
| Strength after shrinkage (xG margin per match) | −0.03 | 13th |
| Projected final points | 54 | 6th |
Chelsea are 5th in Premier League on 16 points from 10 matches (5 won, 1 drawn, 4 lost): 1.60 points a match. Points can lie over a short run, so Moneyball asks three more questions. Expected points are the points a team's chances usually earn; they rank this side 12th. The Pi-rating moves after every result by how far the score beat or missed what was expected; it ranks them 7th. And the projection plays the rest of the season from their chances: about 54 points, 6th.
They have 2.8 points more than their chances deserved. That is the first warning in this column: part of the table is fortune, and fortune does not sign a contract.
14. What this team is good at
| Per match, this season | Chelsea | Rank of 20 |
|---|---|---|
| Shots on target | 5.7 | 1st |
| Big chances | 1.9 | 6th |
| Corners | 5.5 | 6th |
| Dribbles | 7.5 | 6th |
The strengths are clear: shots on target (1st of 20), big chances (6th of 20), corners (6th of 20). They create 1.39 xG a match and allow 1.44. xG is the value of the chances: every shot gets a number between 0 and 1 for how often a shot like it goes in. A side that wins that count most weeks wins most seasons.
15. The weakness, measured
| Per match, this season | Chelsea | Rank of 20 |
|---|---|---|
| Clean sheets | 20.0% | 13th |
| Aerial duels won | 14.6 | 12th |
| Shots | 13.6 | 11th |
| xG for | 1.39 | 11th |
Every team has a list like this one, and good opponents read it. For Chelsea it starts with clean sheets (13th of 20), aerial duels won (12th of 20), shots (11th of 20). The reports in September pointed at the defence: 12 conceded in five. The question the ranks answer is whether that was a bad month or a pattern. On chances allowed Chelsea rank 10th of 20. That is not the rank of a broken defence. The team gives up fewer good chances than the goals suggested, which points at errors and at finishing against them, not at the plan.
At the back, the goals they concede match the chances they allow: no hidden problem, no hidden luck. Up front they have scored 5.1 more than their chances were worth, which rarely lasts a season.
16. The players carrying it
| Player | Minutes | Rating | Goals | Assists | xG |
|---|---|---|---|---|---|
| João Pedro | 521 | 7.65 | 5 | 3 | 3.14 |
| Cole Palmer | 880 | 7.36 | 3 | 3 | 3.10 |
| Morgan Rogers | 883 | 7.26 | 5 | 1 | 2.09 |
| Jordan Henderson | 447 | 7.25 | 2 | 1 | 0.44 |
| Emiliano Martínez | 525 | 7.24 | 0 | 0 | 0.00 |
| Pedro Neto | 745 | 7.07 | 3 | 1 | 1.79 |
| Wesley Fofana | 495 | 7.06 | 0 | 0 | 0.16 |
| Roméo Lavia | 473 | 6.98 | 1 | 1 | 0.74 |
The best-rated regular is João Pedro (7.65), ahead of Cole Palmer (7.36). Ratings are per match, from the same data that runs Scouting Players Research, and only players with 270 minutes or more are listed.
Who joined
| Player | Came from | Rating then | Rating now | Change |
|---|---|---|---|---|
| Jordan Henderson | Brentford | 6.70 | 7.25 | +0.55 |
| Morgan Rogers | Aston Villa | 6.92 | 7.26 | +0.34 |
| Emiliano Martínez | Aston Villa | 6.92 | 7.24 | +0.32 |
| Maxence Lacroix | Crystal Palace | 6.95 | 6.82 | −0.13 |
| Pep Chavarría | Rayo Vallecano | 6.80 | 6.64 | −0.16 |
| Mike Penders | Strasbourg | 6.98 | 6.62 | −0.36 |
Who left
| Player | Now at | Rating then | Rating now | Change |
|---|---|---|---|---|
| Liam Delap | Nottingham Forest | 6.60 | 6.88 | +0.28 |
| Marc Cucurella | Real Madrid | 6.85 | 6.85 | −0.00 |
| Andrey Santos | Manchester United | 6.76 | 6.73 | −0.03 |
| Robert Sánchez | Como | 6.81 | 6.74 | −0.07 |
| Trevoh Chalobah | Como | 6.91 | 6.83 | −0.08 |
| Enzo Fernández | Manchester City | 7.25 | 7.15 | −0.10 |
17. 10,000 seasons
To see where this is heading, Moneyball plays the rest of the league season 10,000 times, every match from the chances each club really creates and allows. Chelsea win the title in 0% of those seasons and finish in the top four in 12%. In those seasons fourth place needs about 63 points and first about 77.
The Moneyball verdict
Exposed, or exaggerated? On the numbers the word "exposed" is too strong. The chances Chelsea allow are not those of a team that has been found out. They are 5th in the table and 12th on expected points, with 2.8 points more than their chances deserved.
The goals they concede match the chances they allow, so there is nothing hidden in either direction.
Alonso's sides have always wanted the ball and pressed high to win it back, and the price of that style is space behind the defence when the press is beaten. That is a trade, not a secret. In 10,000 simulated seasons Chelsea finish in the top four in 12%. Whether that is good enough for Chelsea is a question about the club's patience, and that is one thing no model measures.
- Expected goals (xG): the quality of every chance, so a team is judged on what it created and allowed, not only on what went in.
- Expected points: each match's xG run through a Dixon-Coles score matrix (the Poisson model with the low-score correction the Match Board uses) to give the points a performance usually earns.
- Pi-ratings: a rating for every club at home and away, moved after each result by how far the goal margin beat or missed what the ratings expected.
- Bayesian shrinkage: a club's xG margin is pulled toward the league average as if it had 8 average matches more, so a hot month is not mistaken for a new level.
- Projection: the shrunk strength played out against an average opponent for every match left, added to the points already won.
- Finishing and goalkeeping regression: goals against xG at both ends. A big gap either way rarely lasts a season.
- League ranks on Sportmonks' team figures: possession, passing, pressure, chances, duels.
- Player ratings per 90, from the same Sportmonks data that runs Moneyball Scout.
- Home and away split: points per match on each side of the fixture list.
- Monte Carlo, 10,000 seasons: every remaining match played from each club's shrunk xG strength through the Dixon-Coles score matrix.
- Strengths and weaknesses by rank: the club's figures per match ranked against every club in its league.
- Squad turnover: who left and who joined, last season's minutes against this season's.
Analysis by Moneyball Editorial. Alonso's 233 days at Real Madrid and his dismissal in January 2026 are as reported by ESPN; the 3-0 home defeat to Brentford, the three league matches without a win and the 12 goals conceded in five are as reported by Sky Sports and Sports Illustrated in September 2026. Every other figure is read from the Sportmonks data at each update, and the sentences around it change with it.
Chelsea in the Stats Centre João Pedro in the Stats Centre Cole Palmer in the Stats Centre Morgan Rogers in the Stats Centre
Questions
- What is Xabi Alonso's weakness at Chelsea?
- Ranked against the Premier League, Chelsea's weakest figures are clean sheets (13th of 20), aerial duels won (12th of 20), shots (11th of 20).
- Where are Chelsea in the Premier League table?
- Chelsea are 5th with 16 points from 10 matches, and 12th on expected points.
- Will Chelsea finish in the top four in 2026/27?
- In 10,000 simulated seasons played from every club's chances, Chelsea finish in the top four in 12% and win the title in 0%.